
A Dash/Plotly dashboard for comparing commute time estimates across routing providers.
More Plotly Dashboarding lately.
Have been working on incorporating guidelines for font usage, subtitle text, and using panes to organize content. This one has example data as well, but think it shows the type of in-depth analysis that occurred on this project.
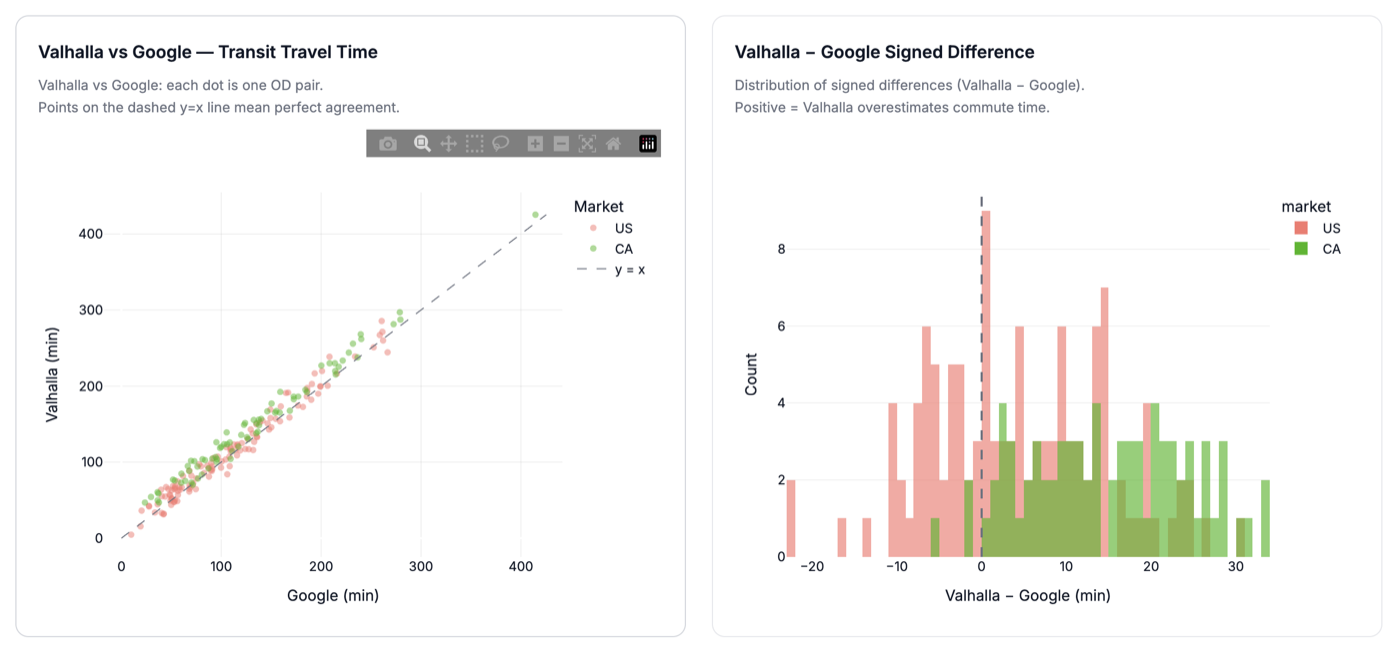 Commute vendor comparison dashboard
A few other conventions I’ve found stakeholders like:
- Methodology and Summary markdown at the top - a high level overview at the start
- Key metric cards
- Filters for drilling down to specific markets
- GGplot inspired colors - bright and easy to see on screen
- Error analysis and breakdown of assumptions/caveats and potential ‘gotchas’
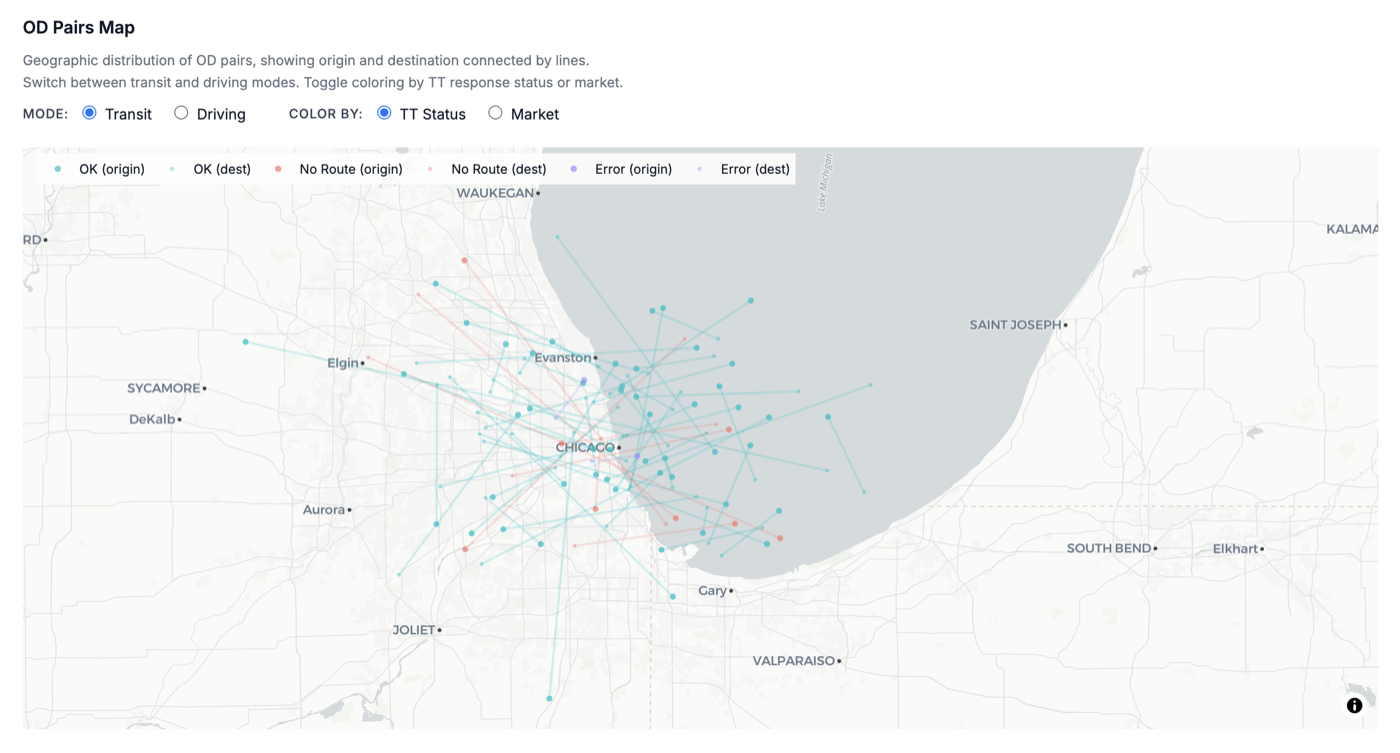 Origin-destination pairs map
Quickly building up templates and agent skills to create dashboards like this that used to take a week plus, into 30 minute sessions.