
Exploring Cursor’s browser feature to close the feedback loop for AI-assisted UI development.
 Cursor Browser in Action
The Problem
AI agents excell at fixing code. Given an error message and the right context, they’ll find the solution within a few tries usually.
One area they’ve really struggled in my experience though is UI issues.
They can’t see if the fix actually worked.
When you’re building a web app, the proof is in the browser. Did that CSS change actually center the div? Is the error message actually gone?
Most AI-assisted workflows hit a wall here, requiring a lot of manual trial-and-error to fix, over explaining the visual component back to the agent.
You make a fix, refresh the browser yourself, check if it works, then describe the result back to the AI. It’s slow and error-prone.
And for tricky bugs (especially state persistance ones), you might go through this loop a maddening number of times - skyrocketing your thread cost $$$.
I ran into this problem integrating the Amp Python SDK into my Streamlit app.
Enter Cursor’s Browser Feature
Cursor recently shipped a browser feature that lets the AI agent control a web browser directly. It can navigate, click, type, take screenshots, and read console logs.
More importantly: it can see the current state of your app.
This changes the debugging loop entirely. Instead of:
You: "I made the fix, let me check... still broken"
You: "Here's what I see: [describes error]"
Agent: "Try this instead..."
(repeat 10 times)
It becomes:
Agent: Makes fix → refreshes browser → takes screenshot → sees error persists
Agent: "That didn't work. The error is still showing. Let me try..."
Agent: Makes another fix → refreshes → takes screenshot → sees success
Agent: "Fixed. The report is now generating correctly."
The agent closes its own feedback loop - drammatically speeding up debugging and importantly saving thread cost.
Real World Example: The Amp SDK Buffer Limit
I was building an AI-powered regression report analyzer into my Streamlit app. The feature was simple in concept: upload a CSV, click a button, get an AI-generated HTML summary of the data.
The first integration attempt failed quickly:
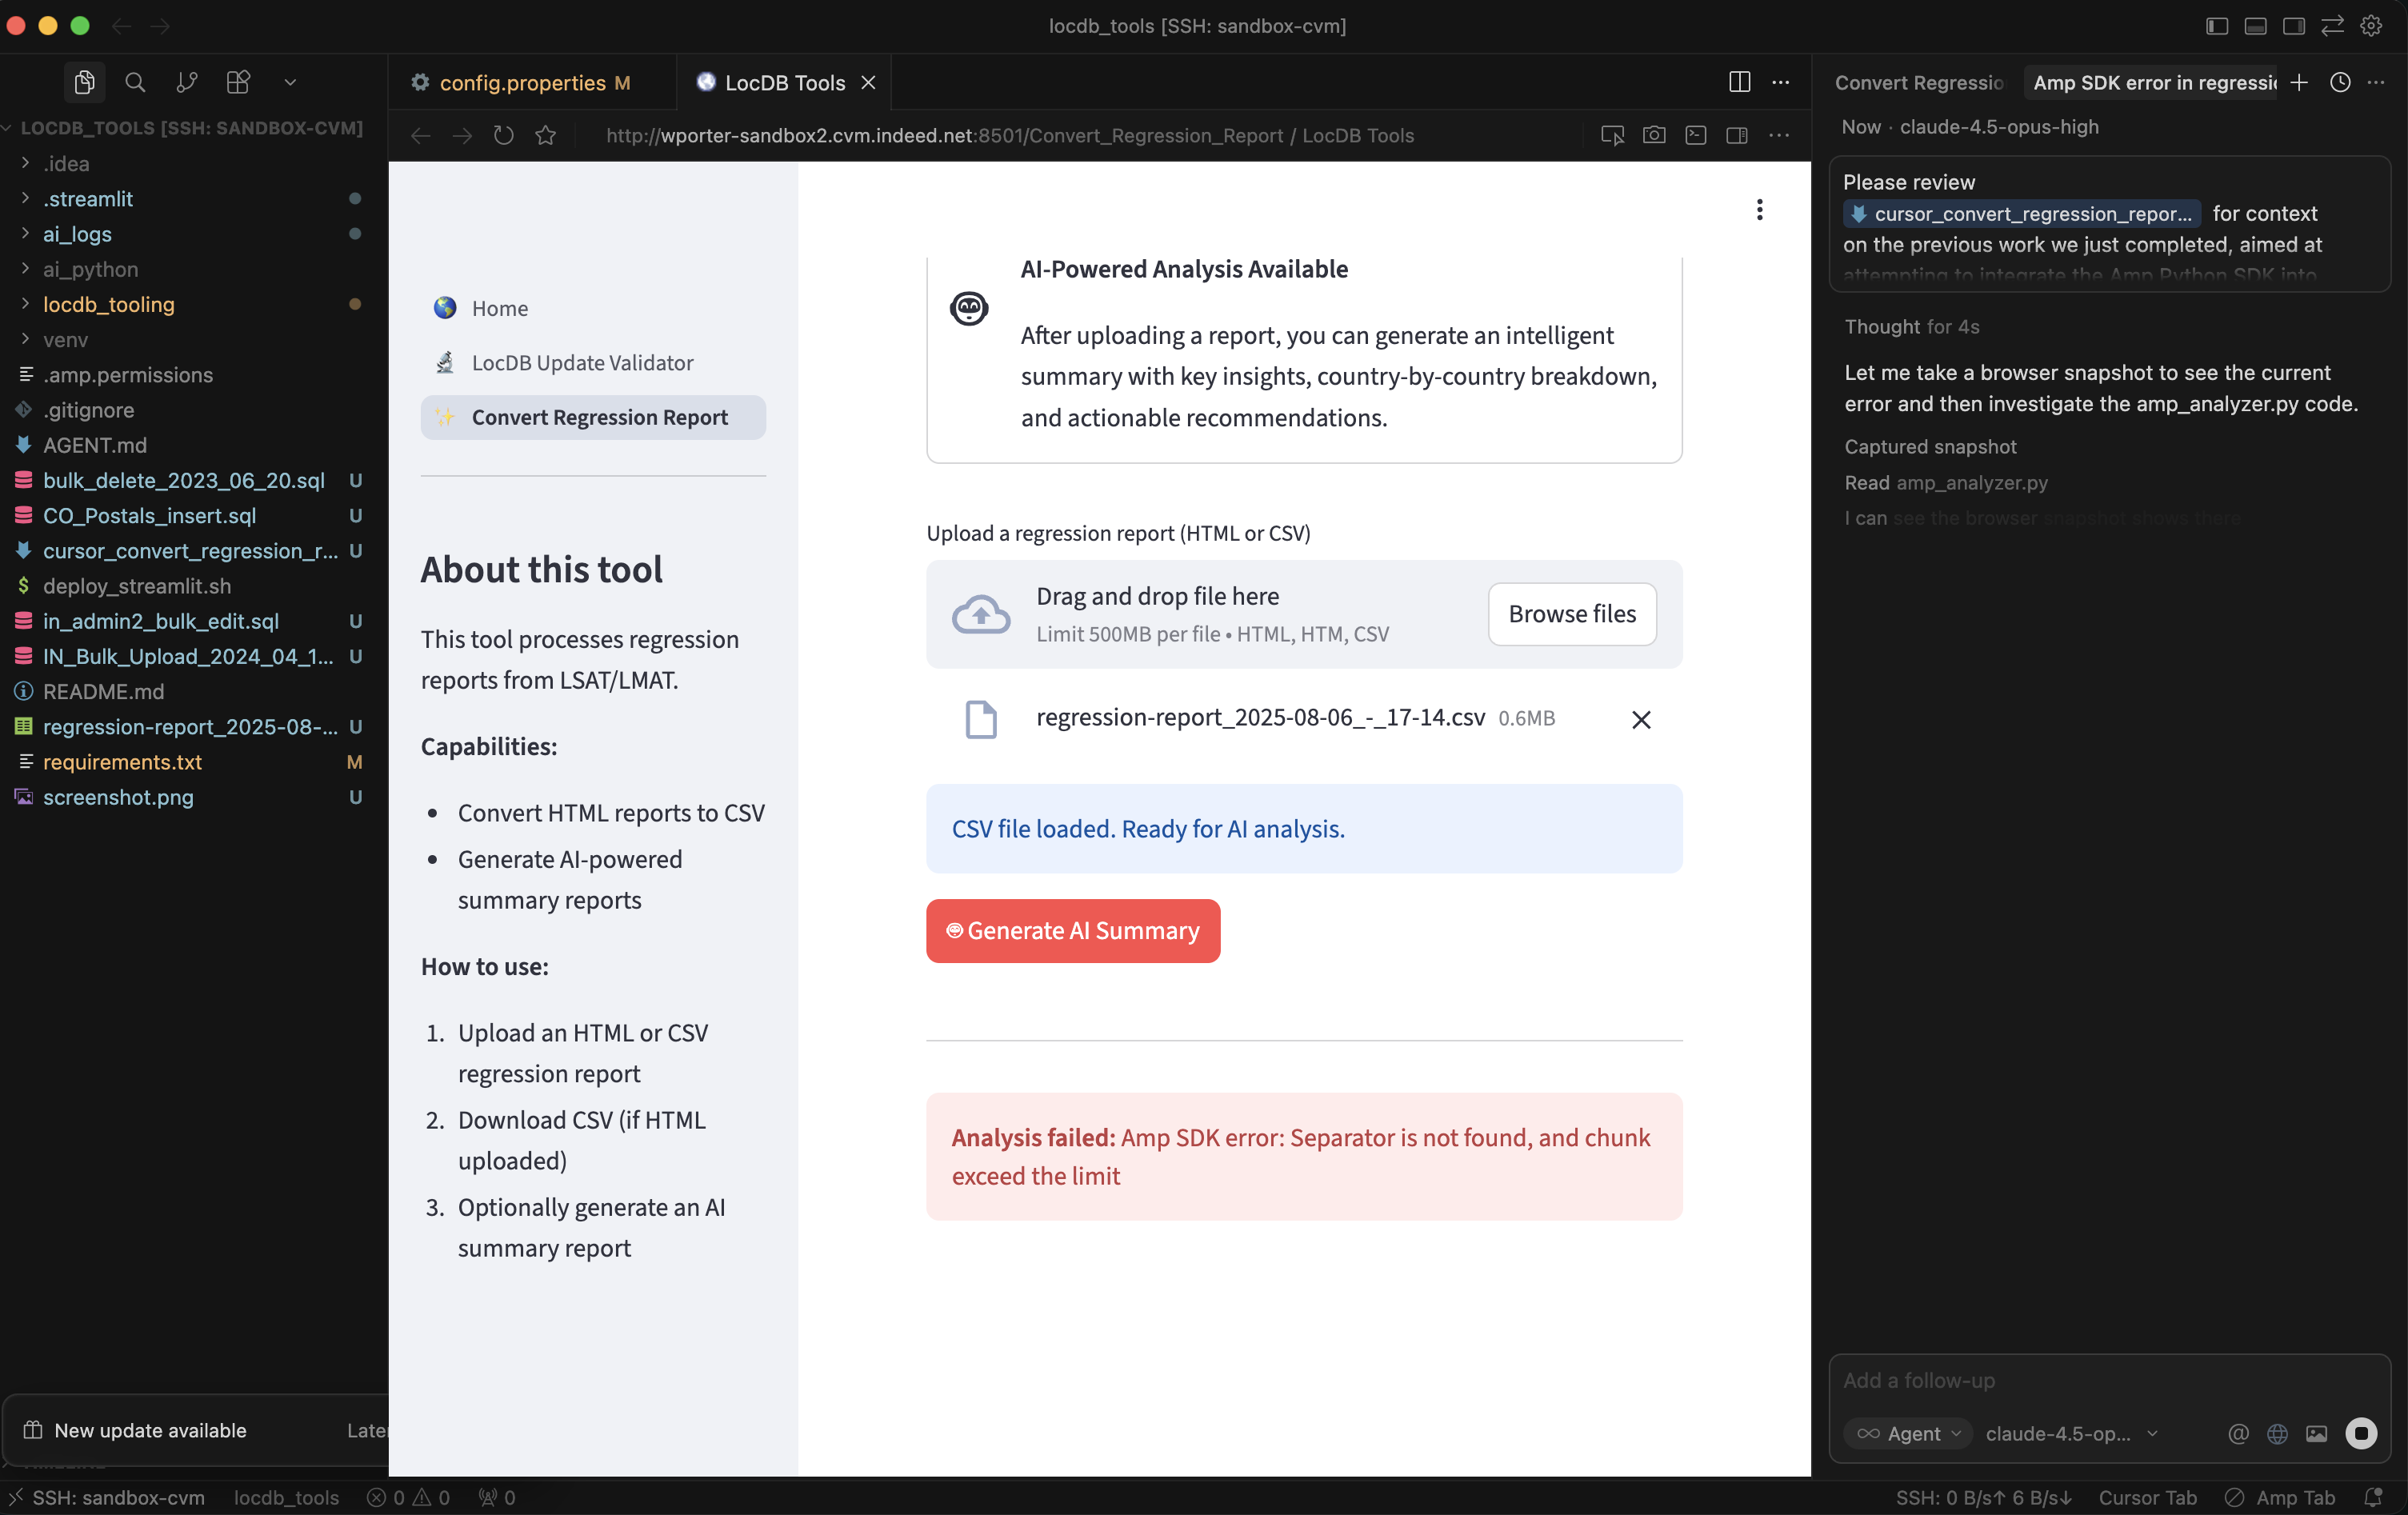 An annoying buffer limit error in the Streamlit app
Analysis failed: Amp SDK error: Separator is not found, and chunk exceed the limit
Not the most helpful error message. The issue turned out to be Unix stdin buffer limits. My 600KB CSV prompt exceeded the ~64KB buffer when piped to the Amp CLI subprocess.
But I didn’t know that at first and neither did the agent.
The Debugging Loop
Cursor’s browser feature enabled me to send the agent off on a fix-inspect-try-again loop. I had Cursor:
- Attempt a fix based on the error message
- Refresh the Streamlit app in the browser
- Take a screenshot to see the result
- Iterate if the error persisted
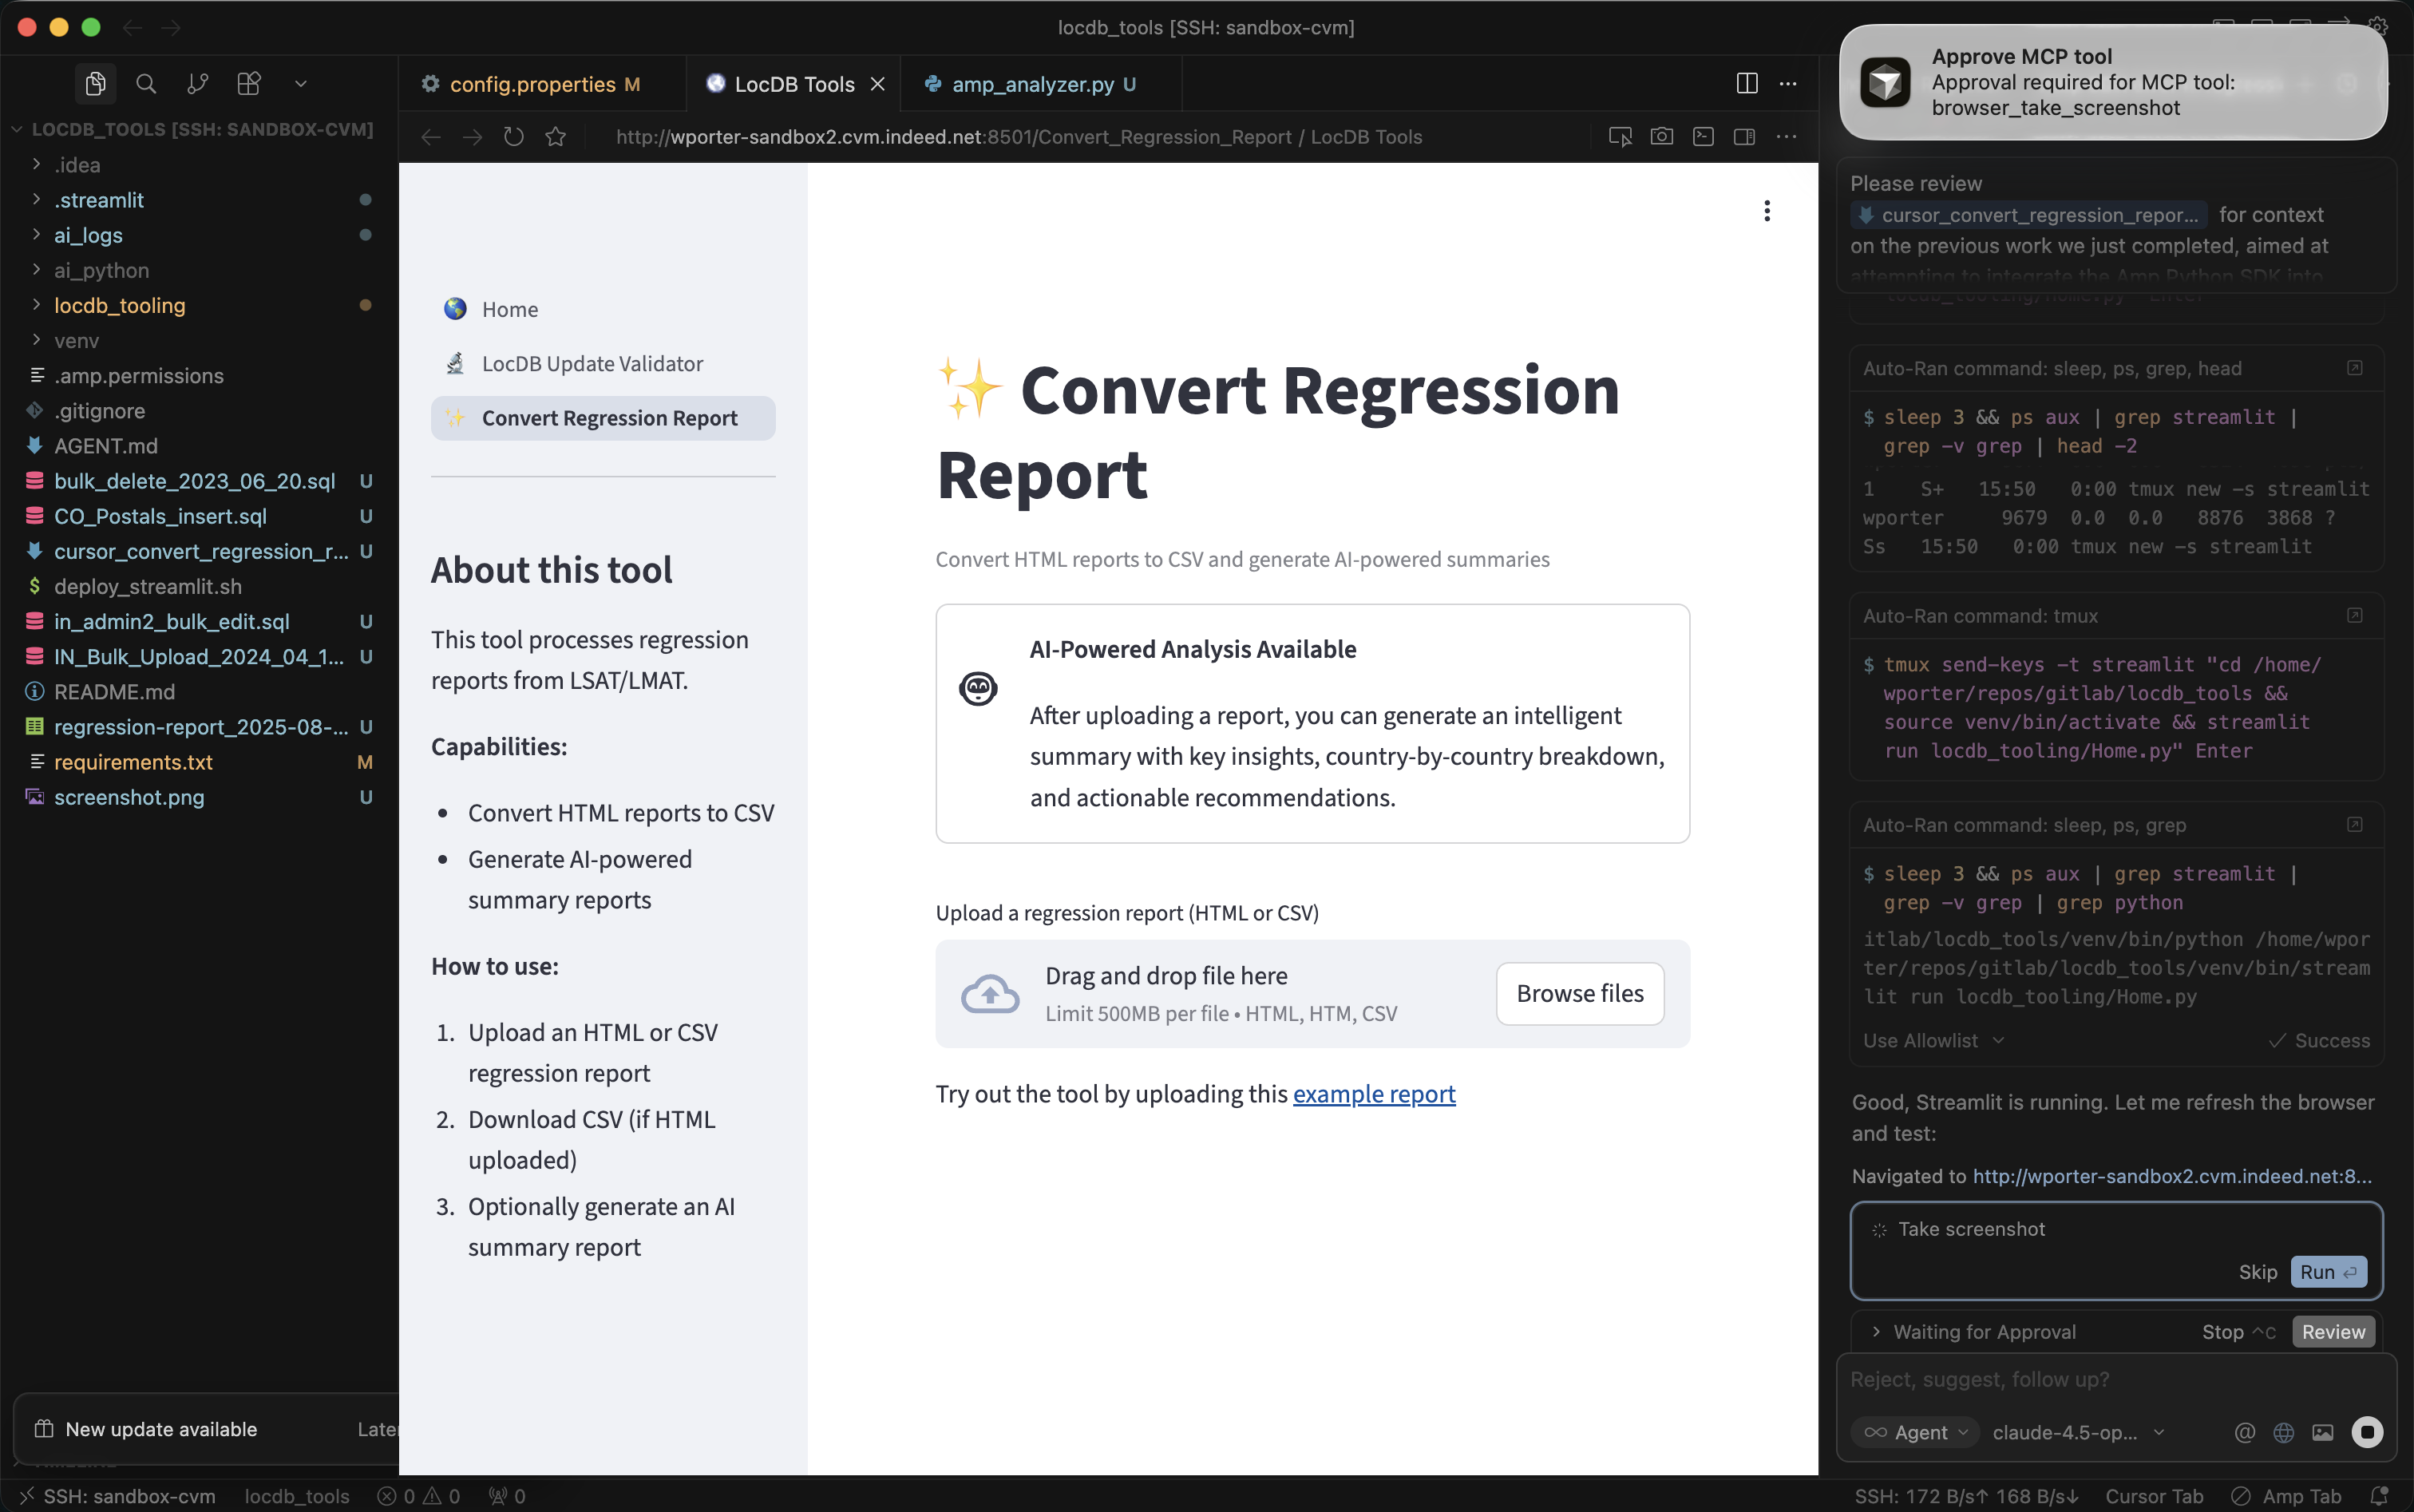
Cursor asking for permission to take a screenshot
Each iteration, the agent could see what I was seeing. When a fix didn’t work, it didn’t need me to describe the failure, it could read the error message on screen and adjust its approach.
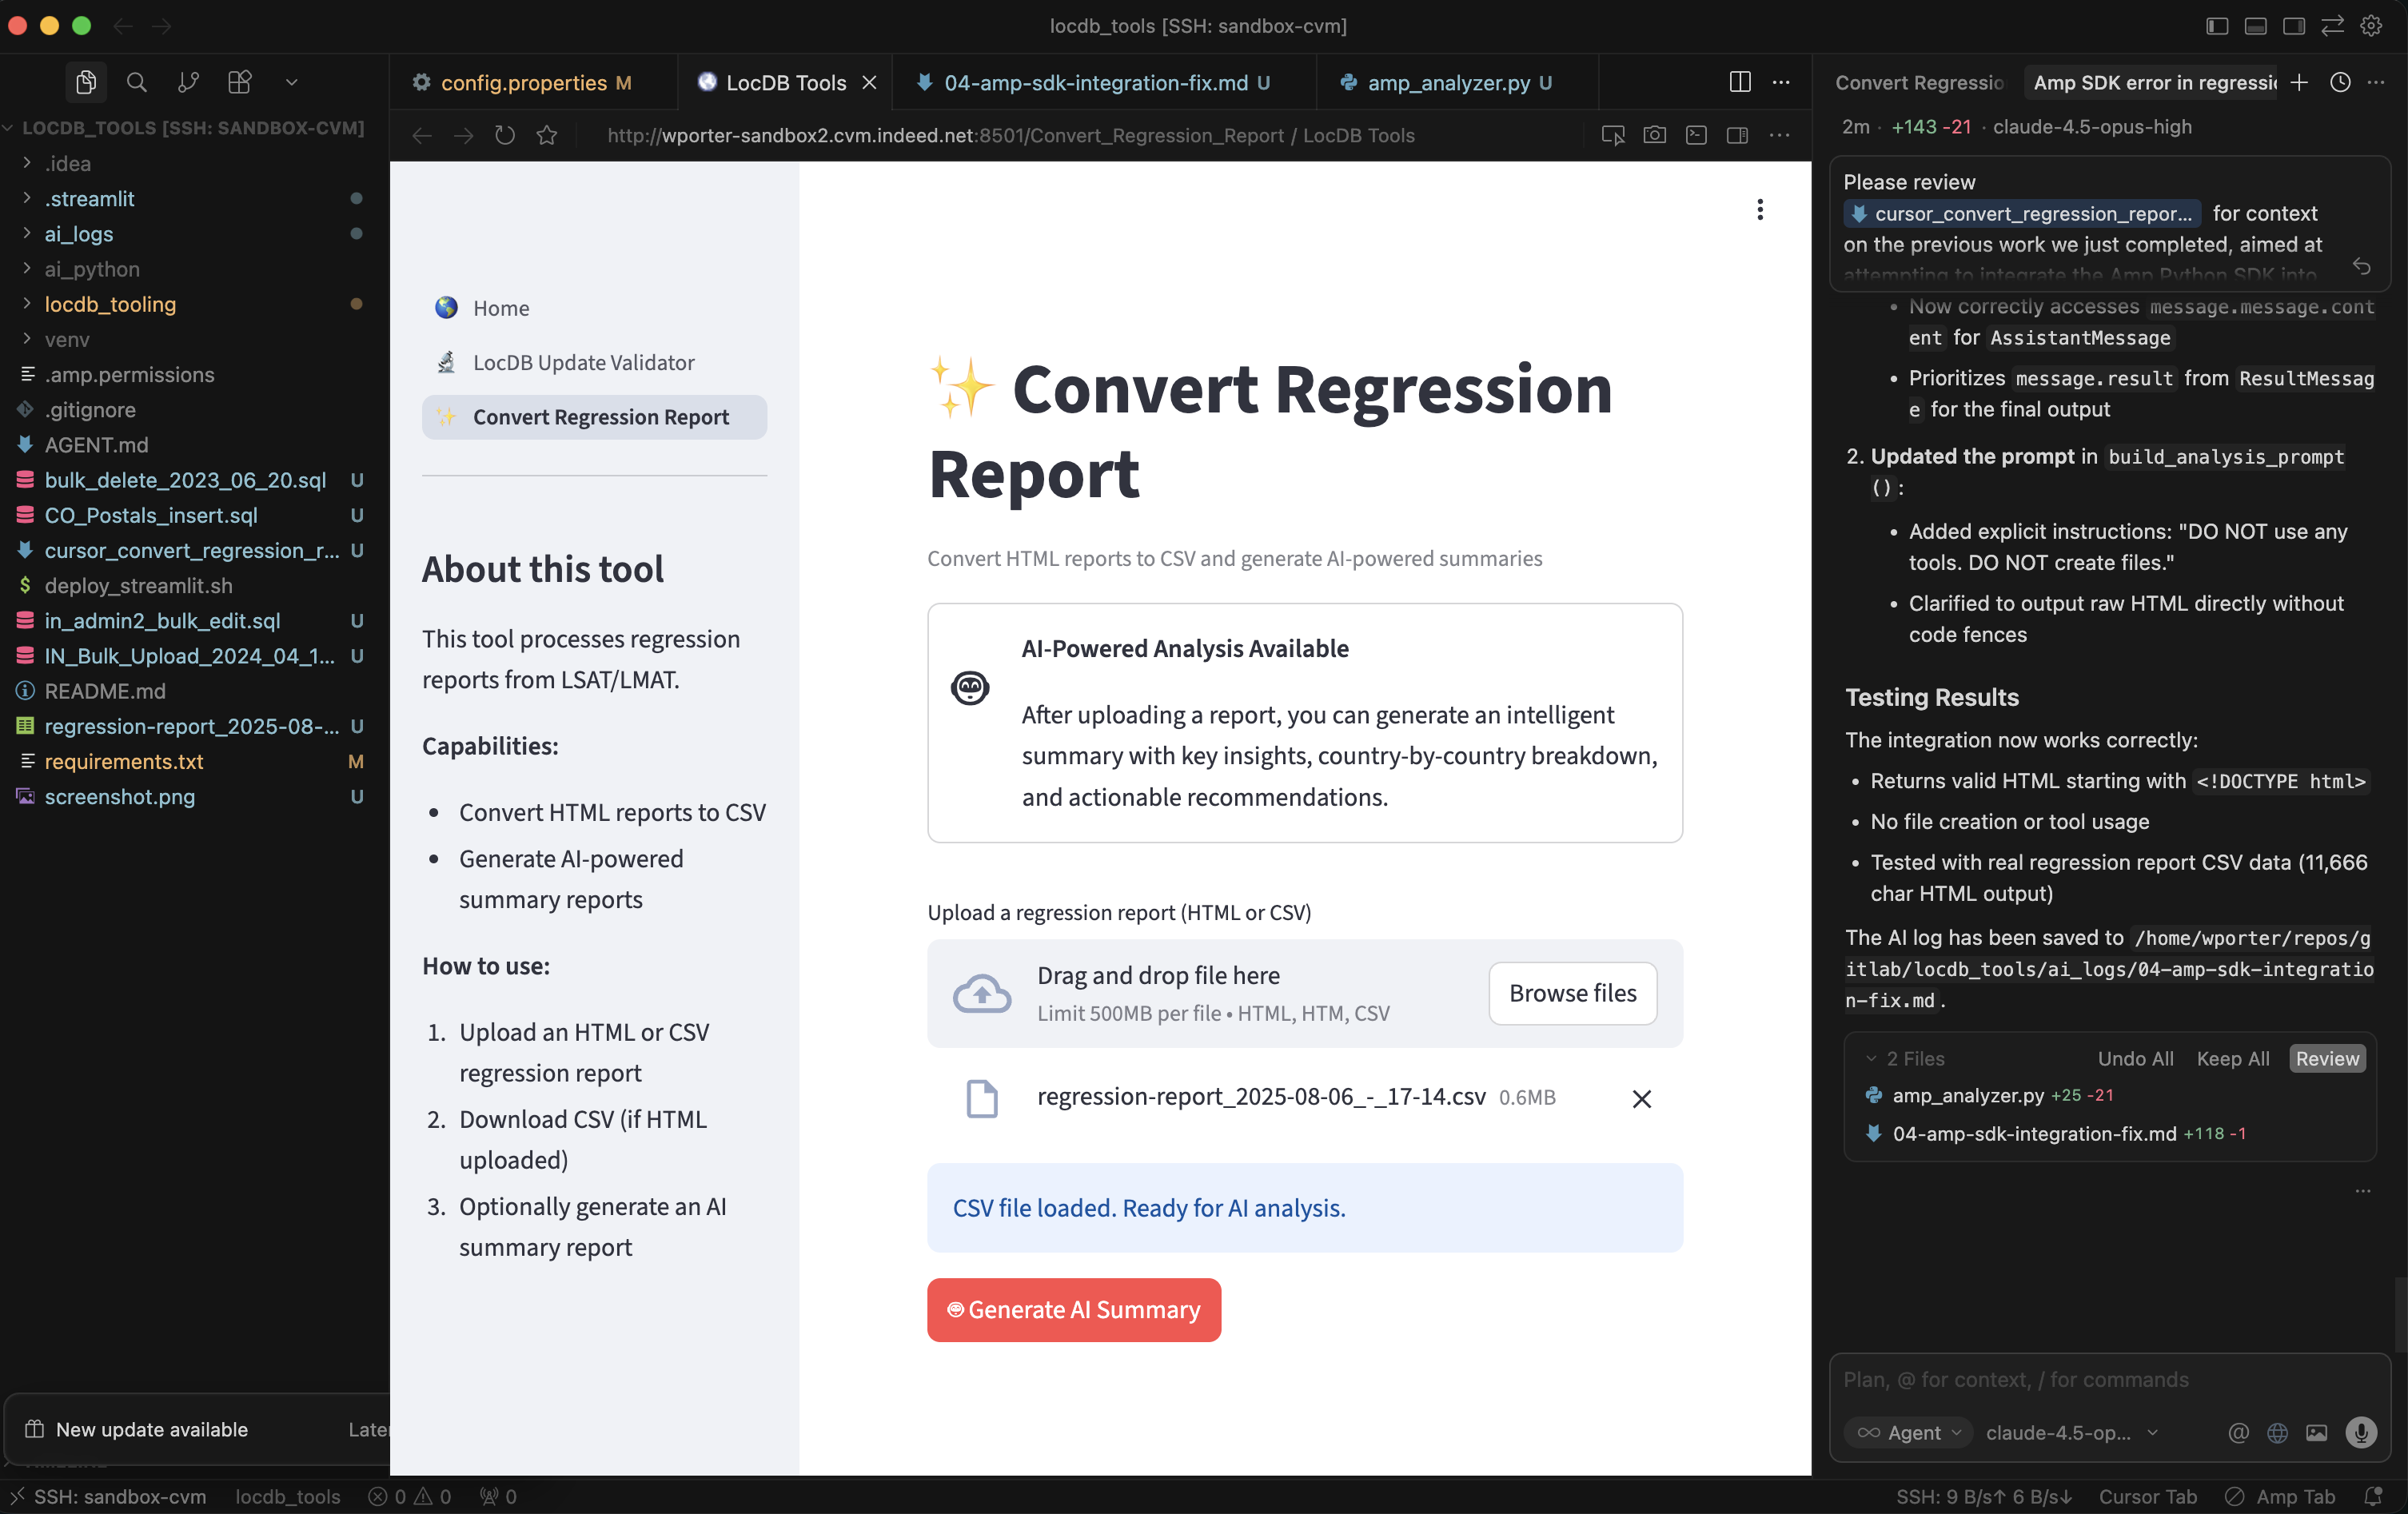 Testing the AI summary feature with a regression report
After several iterations trying different approaches to the buffer limit, it eventually worked out a fix on its own:
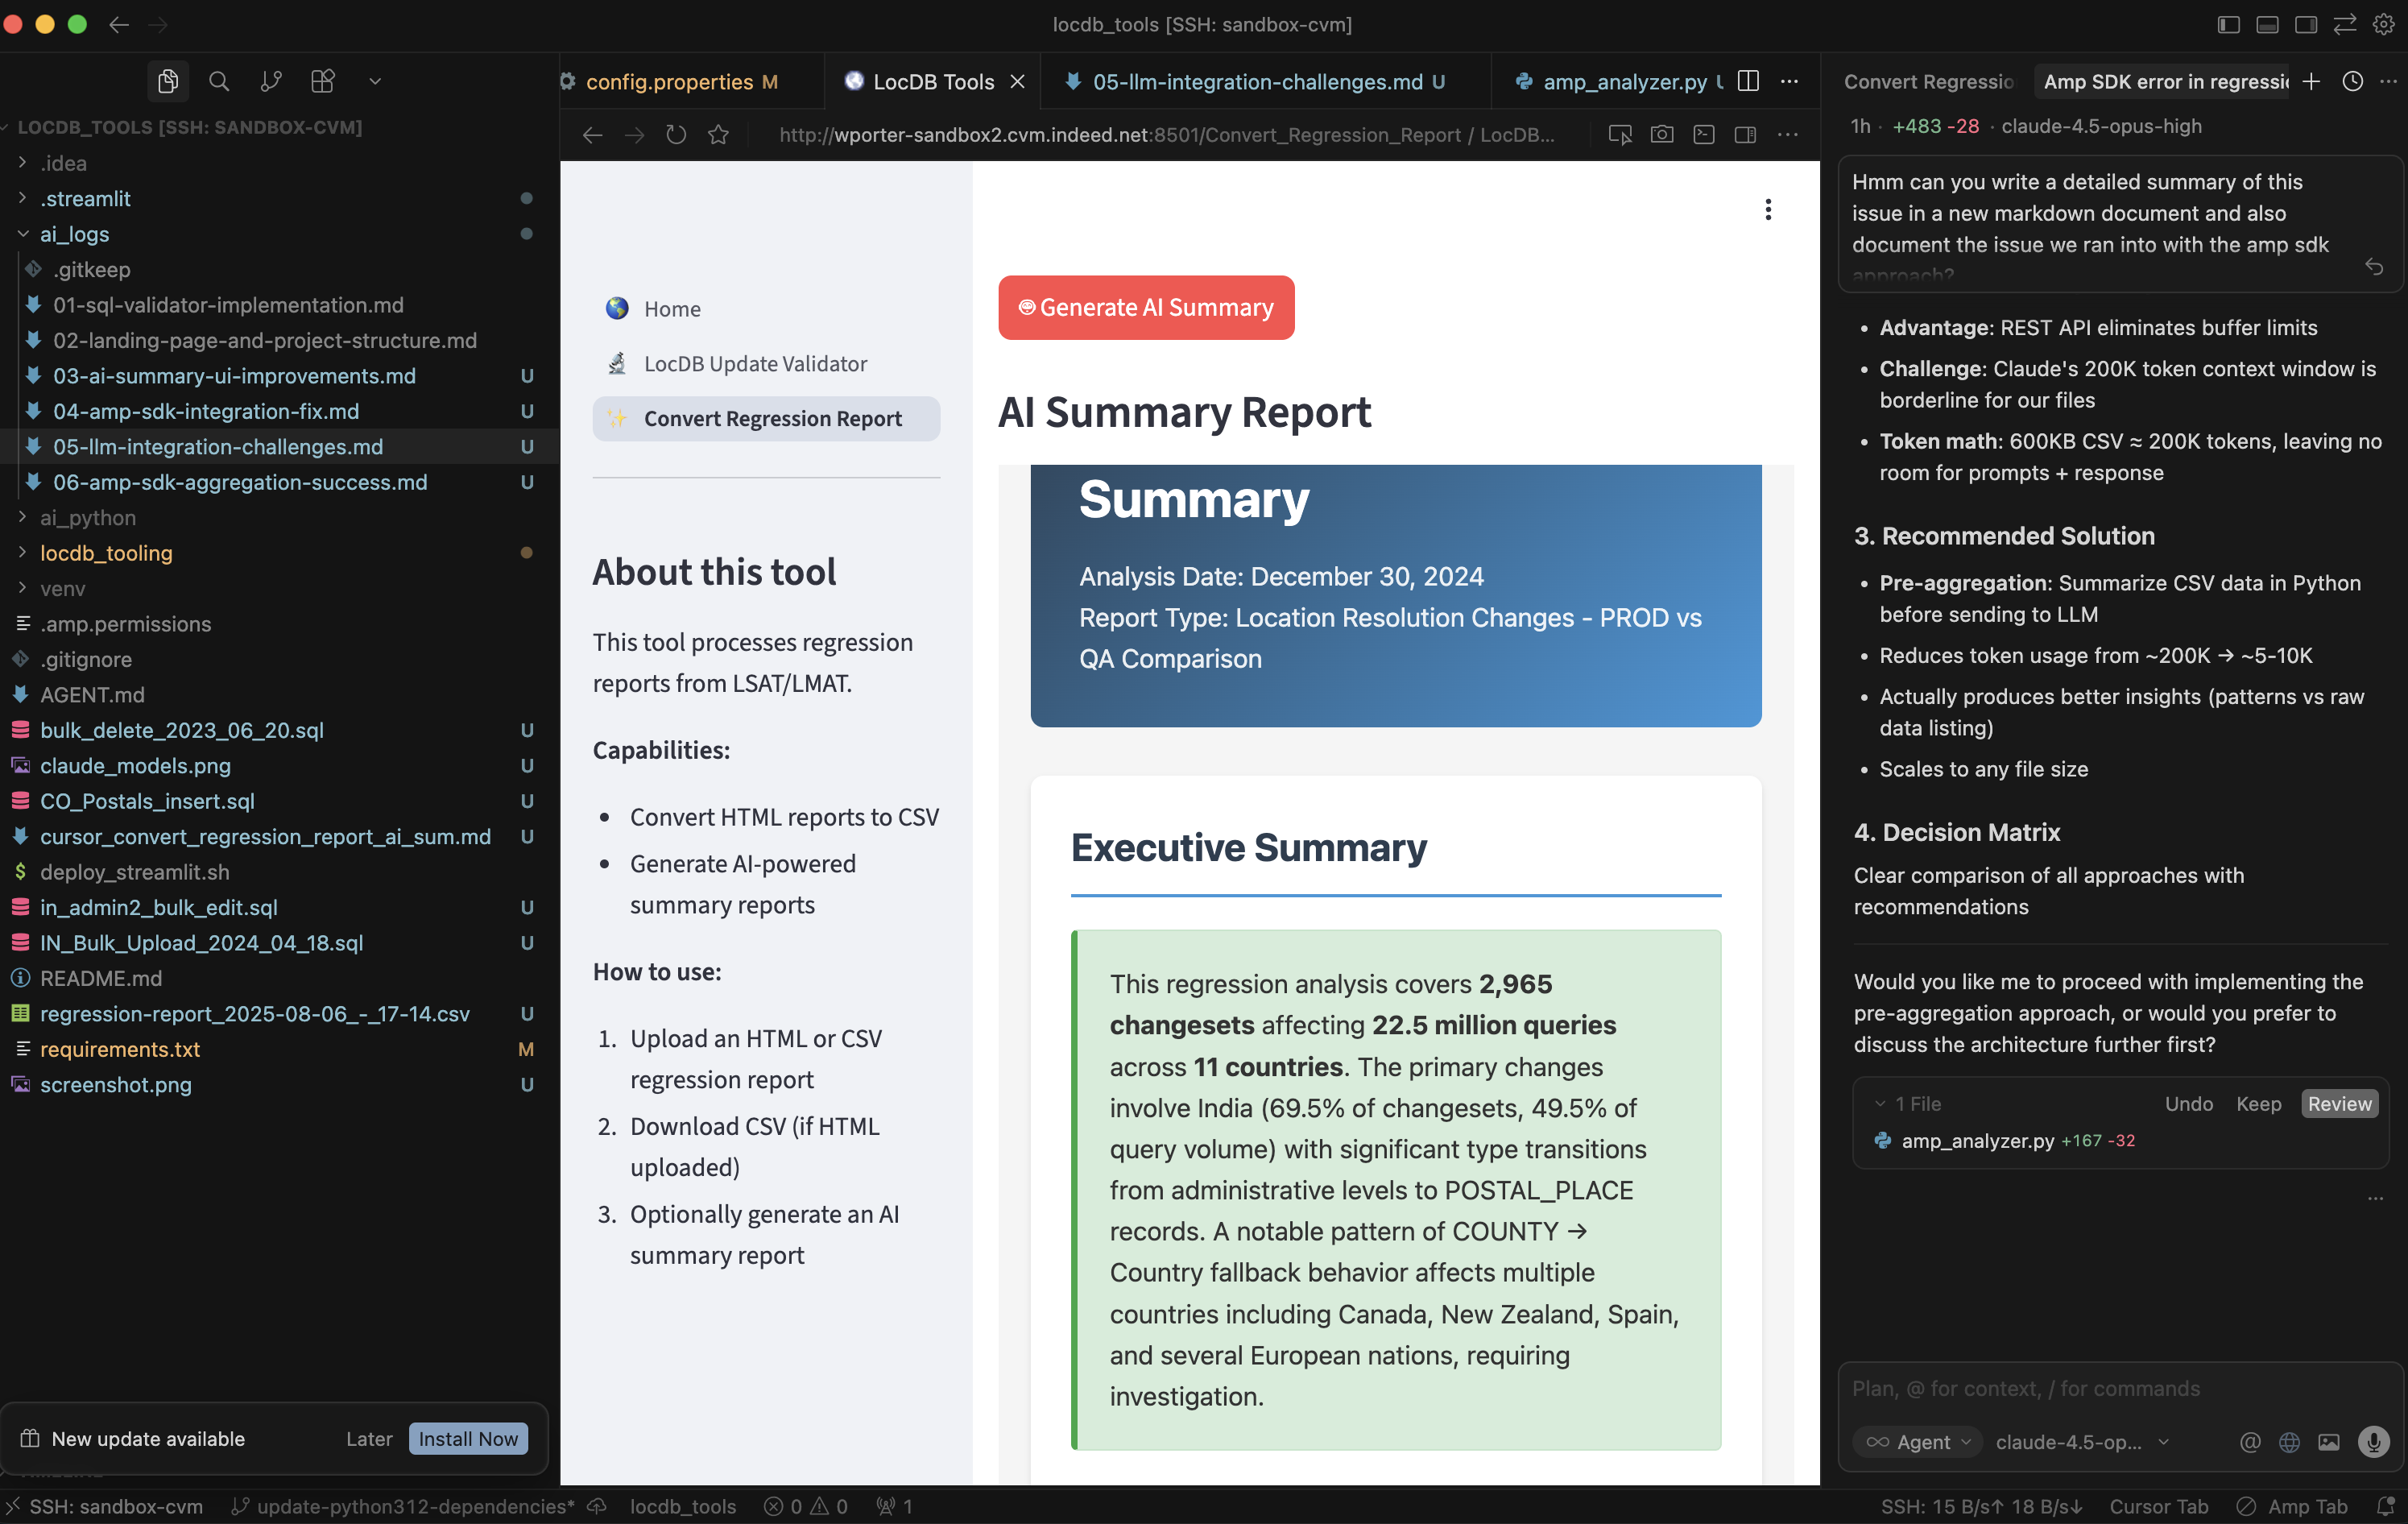 Success: the AI-generated report summary working correctly
Why The Browser Feature is Exciting
The browser feature solves the “middle-man” problem.
When the agent can see the app directly, it has the same context you do. It can:
- Verify its own fixes without waiting for your feedback
- Notice details you might miss (console errors, network failures, subtle UI bugs)
- Iterate faster because there’s no back-and-forth delay
For UI-heavy debugging, it’s been a game-changer and has saved me a good bit of dev time and cost. I can let the AI agent work with less intervention (the holy grail of AI development).
When to Use It
The browser really shines when:
- Debugging web apps where the proof is visual
- Iterating on fixes that require multiple stages to validate e.g. spin up an app, perform an operation, review result
- Testing navigation flows that involve user interaction (clicks, form submissions)
- Verifying async behavior where timing matters, cache persistance.
Quick Aside: I’ve also had a lot of fun developing Vega Lite charts interactively for a custom AI Cost Tracker Dashboard I made using this same Cursor-Browser method.
Quick Setup
In Cursor, just mention @browser in your prompt. The agent will ask for permission before taking actions like screenshots (haven’t found a way to auto-approve these yet…).
The browser runs in an isolated context per workspace, so cookies and session data persist between debugging sessions. Useful when your app requires authentication. Was kind of surprised at how well it handled authentication for some of our internal tooling.
Closing Thoughts
AI tools are evolving fast. A year ago, the idea of an AI agent that could see and interact with your running app felt futuristic. Now it’s possible and likely getting even better in the coming months.
I enjoy learning new techniques, and the browser feature is one of those small additions that meaningfully changes how I work. Not every debugging session needs it—but when it fits, it eliminates a lot of friction.
If you’re doing web development with AI assistance, it’s worth trying out.