
How I used Amp Sourcegraph to turn a multi-day review process into seconds—and what I learned about teaching AI to understand location data.
Background
As part of my day-to-day, I help maintain and curate a location database at Indeed that powers how job postings and searches resolve to geographic locations.
When someone searches for jobs in “Nashville, TN” or “Nashville, Davidson County, TN” our database acts as a global atlas, helping determine what location that search maps to. Think Google Maps, but for jobs!
At first, this might sound fairly straight forward.
Real world location data is messy though - and full of nuance. There are countless variations of how people type locations (unstructured, non-normalized data), and our database/geocoder has to handle all of them gracefully.
Before any changes go to production, we run Regression Reports to catch potential problems. These reports compare how location queries resolve in our current production environment versus a QA environment with proposed changes.
Predicting Change
Enter the regression report.
A regression report shows all changes between environments - every location query that would resolve differently after an update. For a typical database change, we’re looking at *thousands of rows to review.

Each changeset is a pair of rows: how a query resolves in Prod (current) versus QA (proposed). The analyst has to determine if each change is:
- An improvement — a postal code now matching correctly
- No significant change — equivalent resolution
- A regression — “Nashville, TN” suddenly resolving to Nashville, Indiana
Reviewing each changeset manually can take a full business day typically. With 2-3 reports per week, that’s a lot of analyst hours spent on tedious, repetitive review.
I thought there had to be a better way.
Enter Amp
I’d been experimenting with Amp by Sourcegraph, an AI coding agent for various tasks. What caught my attention was Amp’s ability to work with structured workflows and follow detailed instructions consistently.
So I asked myself: could I teach an AI agent to understand Indeed-specific regression reports the way a location analyst does?

Turns out, yes. With the right context.
The Solution
I built a workflow that takes a raw regression report CSV and generates a comprehensive HTML summary with:
- An Executive Summary — one-sentence overview of what’s changing
- Statistics Dashboard — total changesets, countries affected, unique queries, query volume
- Country-by-Country Analysis — color-coded sections for each affected country
- Critical Issue Detection — flagging cross-country misplacements and data quality problems
- Actionable Recommendations — structured next steps for the team
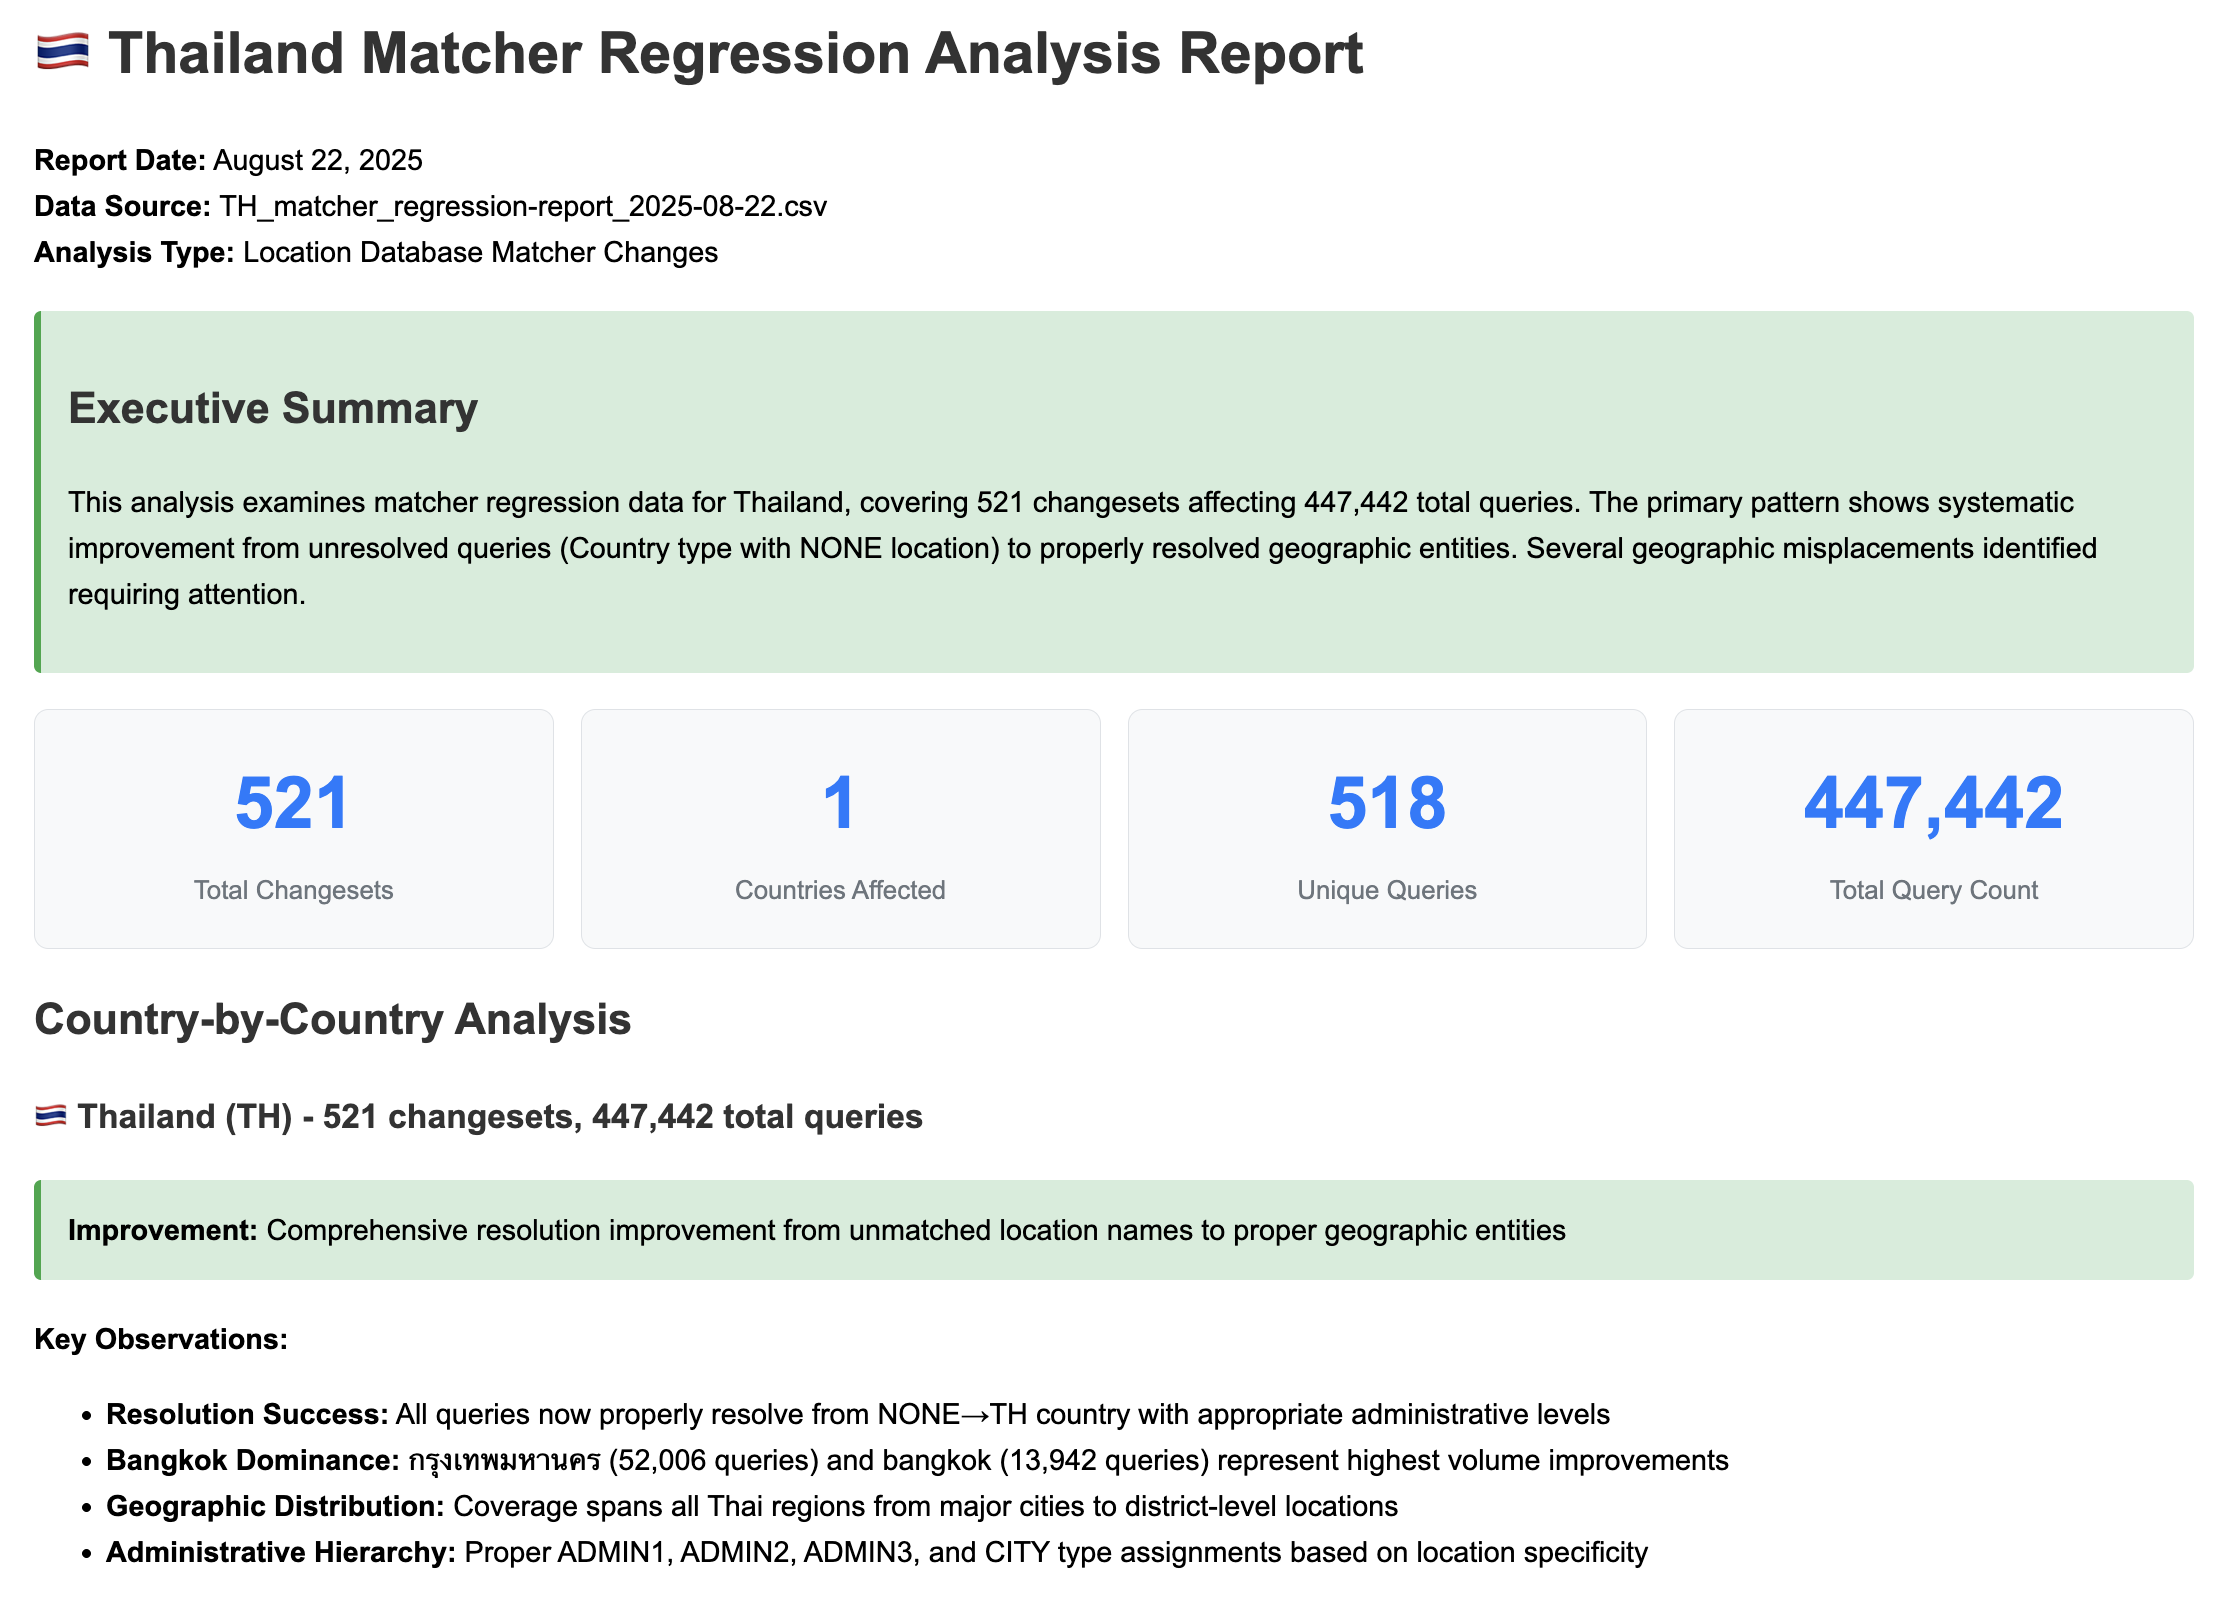 Example HTML summary report generated by Amp
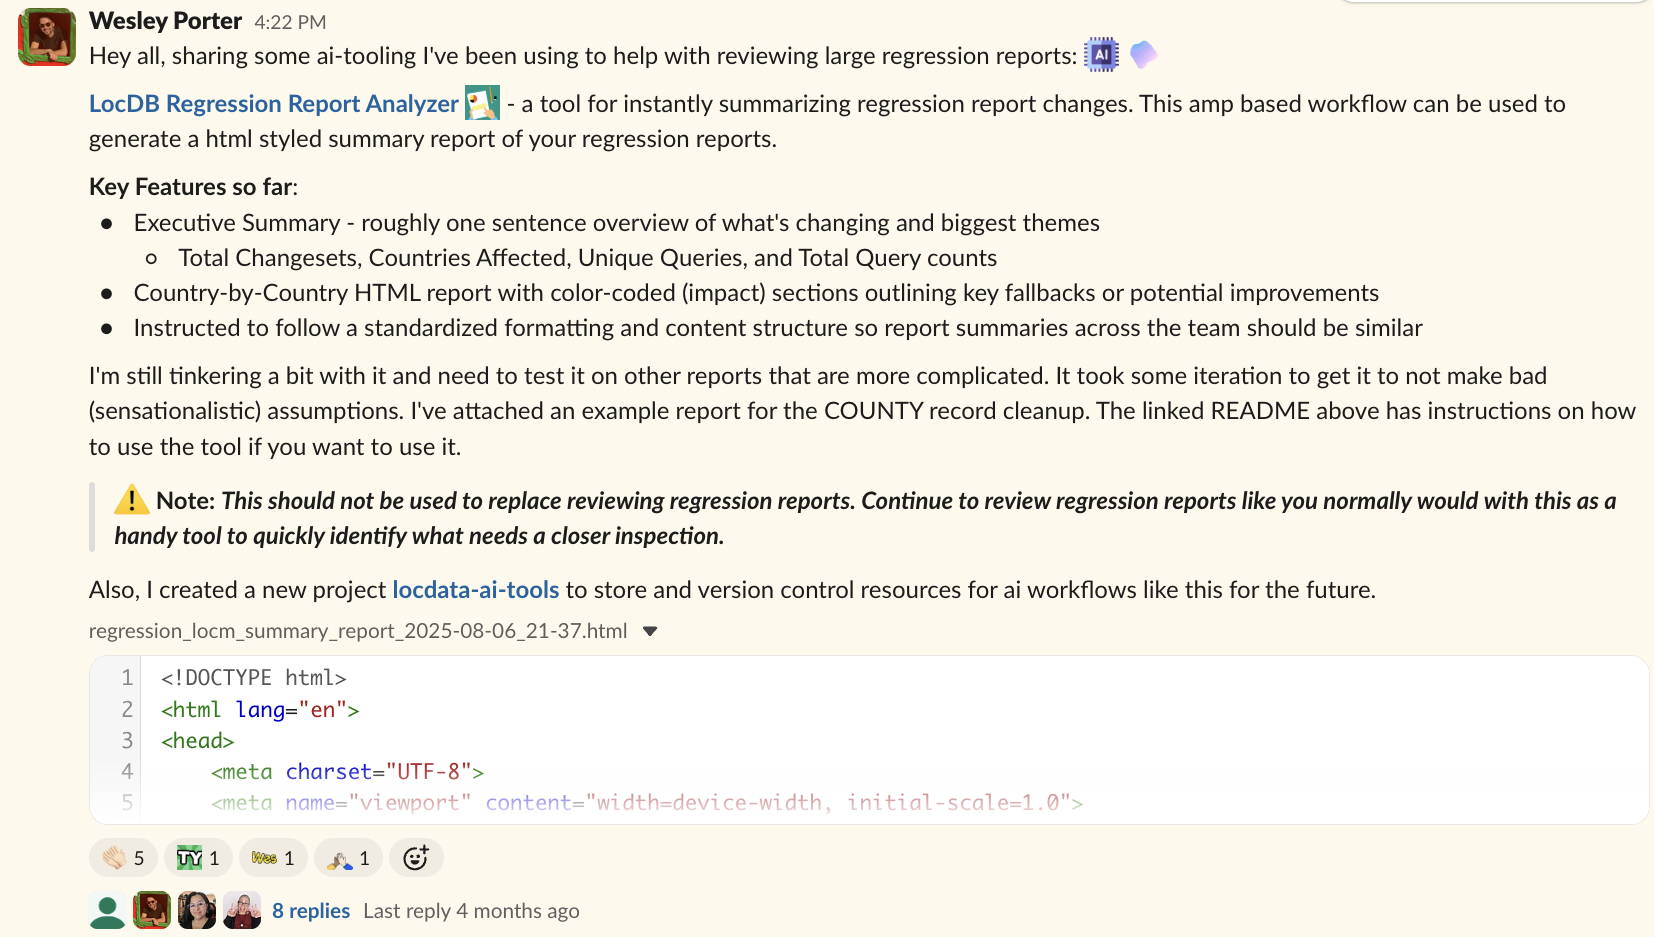 Sharing the tool with my team on Slack
The Prompt Engineering
Getting consistent, useful output from an LLM required a bit of finese.
I created two key documents that Amp references:
Domain Knowledge
First, I wrote AI_Rules_for_Interpreting_Regression_Reports.md—a reference document explaining key concepts:
- What a “changeset” is (Prod vs QA row pairs)
- Location types (COUNTRY, ADMIN, CITY, ZIPCODE, etc.)
- What constitutes a positive vs negative change
- Common terminology (Canonical, Alias, etc.)
This gives the agent the same foundational knowledge a new analyst would need.
Output Standards
Second, I created AGENT.md with a detailed specification for how reports should be generated:
## HTML Report Structure

### Required Sections (in order):
1. **Header** - Report metadata and summary
2. **Executive Summary** - High-level overview in green summary box
3. **Statistics Dashboard** - 4-box metric display
4. **Country-by-Country Analysis** - Detailed breakdown
5. **Critical Issues** - Red critical box for serious problems
6. **Recommendations** - Yellow warning box with actionable items
7. **Technical Impact Assessment** - Table with risk levels
8. **Footer** - Generation metadata
The AGENT.md file specifies everything from CSS color coding to emoji flag usage in country headers.
Learning from Bad Assumptions
Early on the agent would make dramatic conclusions that weren’t warranted.
One memorable example:
“Catastrophic regression detected, 2,000+ COUNTY type records removed from the database!"
Sounds alarming, right?
*Except those COUNTY records were legacy data from before our team existed — not actual counties, but a mixed bag of random geographic entities. Removing them was intentional cleanup, not a catastrophe.
I added explicit guidance to the AGENT.md:
### Objective Language Standards:
- **CRITICAL: Avoid subjective descriptors:** Do not use terms like
  "catastrophic," "massive," "disaster," or "complete loss"
- **Focus on volume and impact:** Use quantitative measures
  (e.g., "92,180 queries affected")
- **Describe behavior objectively:** Use neutral terms like
  "resolution changes," "fallback behavior," "type transitions"
This reflected a key lesson: the AI is only as good as the context you provide. It didn’t know that COUNTY types were legacy junk. Once I gave it the proper context, the outputs became much more useful.
Results
We’ve gone from a process that took at least a full business day to one that takes seconds to generate an initial summary.
We still review the reports. This tool doesn’t replace human judgment. But it surfaces the most important issues to us immediately, letting analysts focus their time on changes that actually need investigation.
Some quick math on time savings:
- Before: ~8 hours per report (conservative estimate)
- After: Seconds to generate + targeted review of flagged issues
- Reports per week: 2-3
- Reports per year: ~100-150
- Hours saved: Even if we’re only saving 4-6 hours of initial triage per report, that’s still 400-900 hours per year
Win win.
What’s Next?
I’m currently exploring the Amp Python SDK to build this into a Streamlit app.
The goal is self-service: analysts upload a regression report -> get back a fully analyzed HTML summary without needing to run prompts themselves.
Beyond regression reports, I’m planning to use similar techniques for automating database quality checks against bulk updates (future blog post?).
Closing Thoughts on AI
The real takeaway here isn’t “AI is magic.” It’s that AI tools like Amp can be genuinely useful when you:
- Understand your domain deeply — you can’t teach what you don’t know
- Provide structured context — domain knowledge docs + output specifications
- Iterate on the prompts — expect bad assumptions, then fix them
- Know the limitations — AI surfaces issues, humans make judgment calls
Important caveat: This tool doesn’t replace reviewing regression reports. It’s a way to quickly identify what needs a closer look. You still need domain expertise to interpret the results.
I’ve version-controlled the AGENT.md and supporting documentation so other team members can reproduce the same workflows. If you’re doing repetitive analytical work with consistent patterns, this approach might be worth exploring.
A little prompt engineering and curiosity pays off.